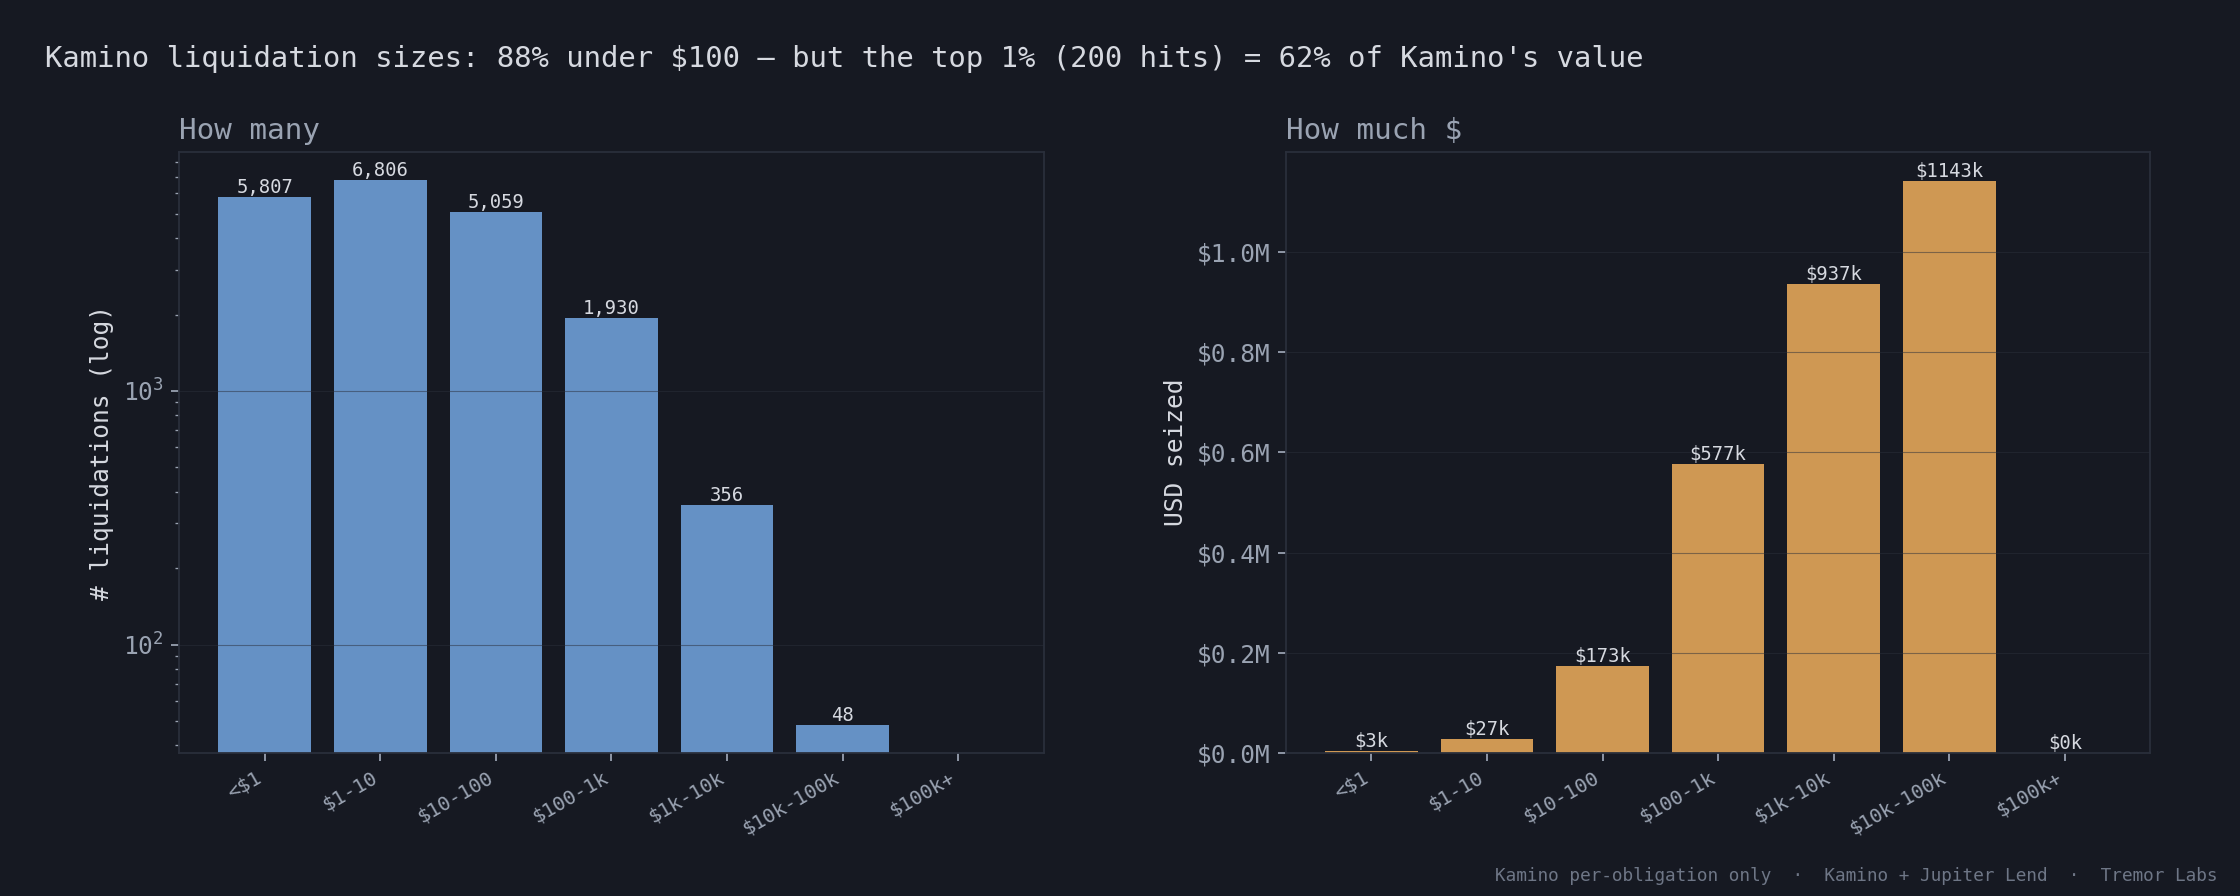
Kamino only. 88% of liquidations <$100; top 1% = 78% of value.
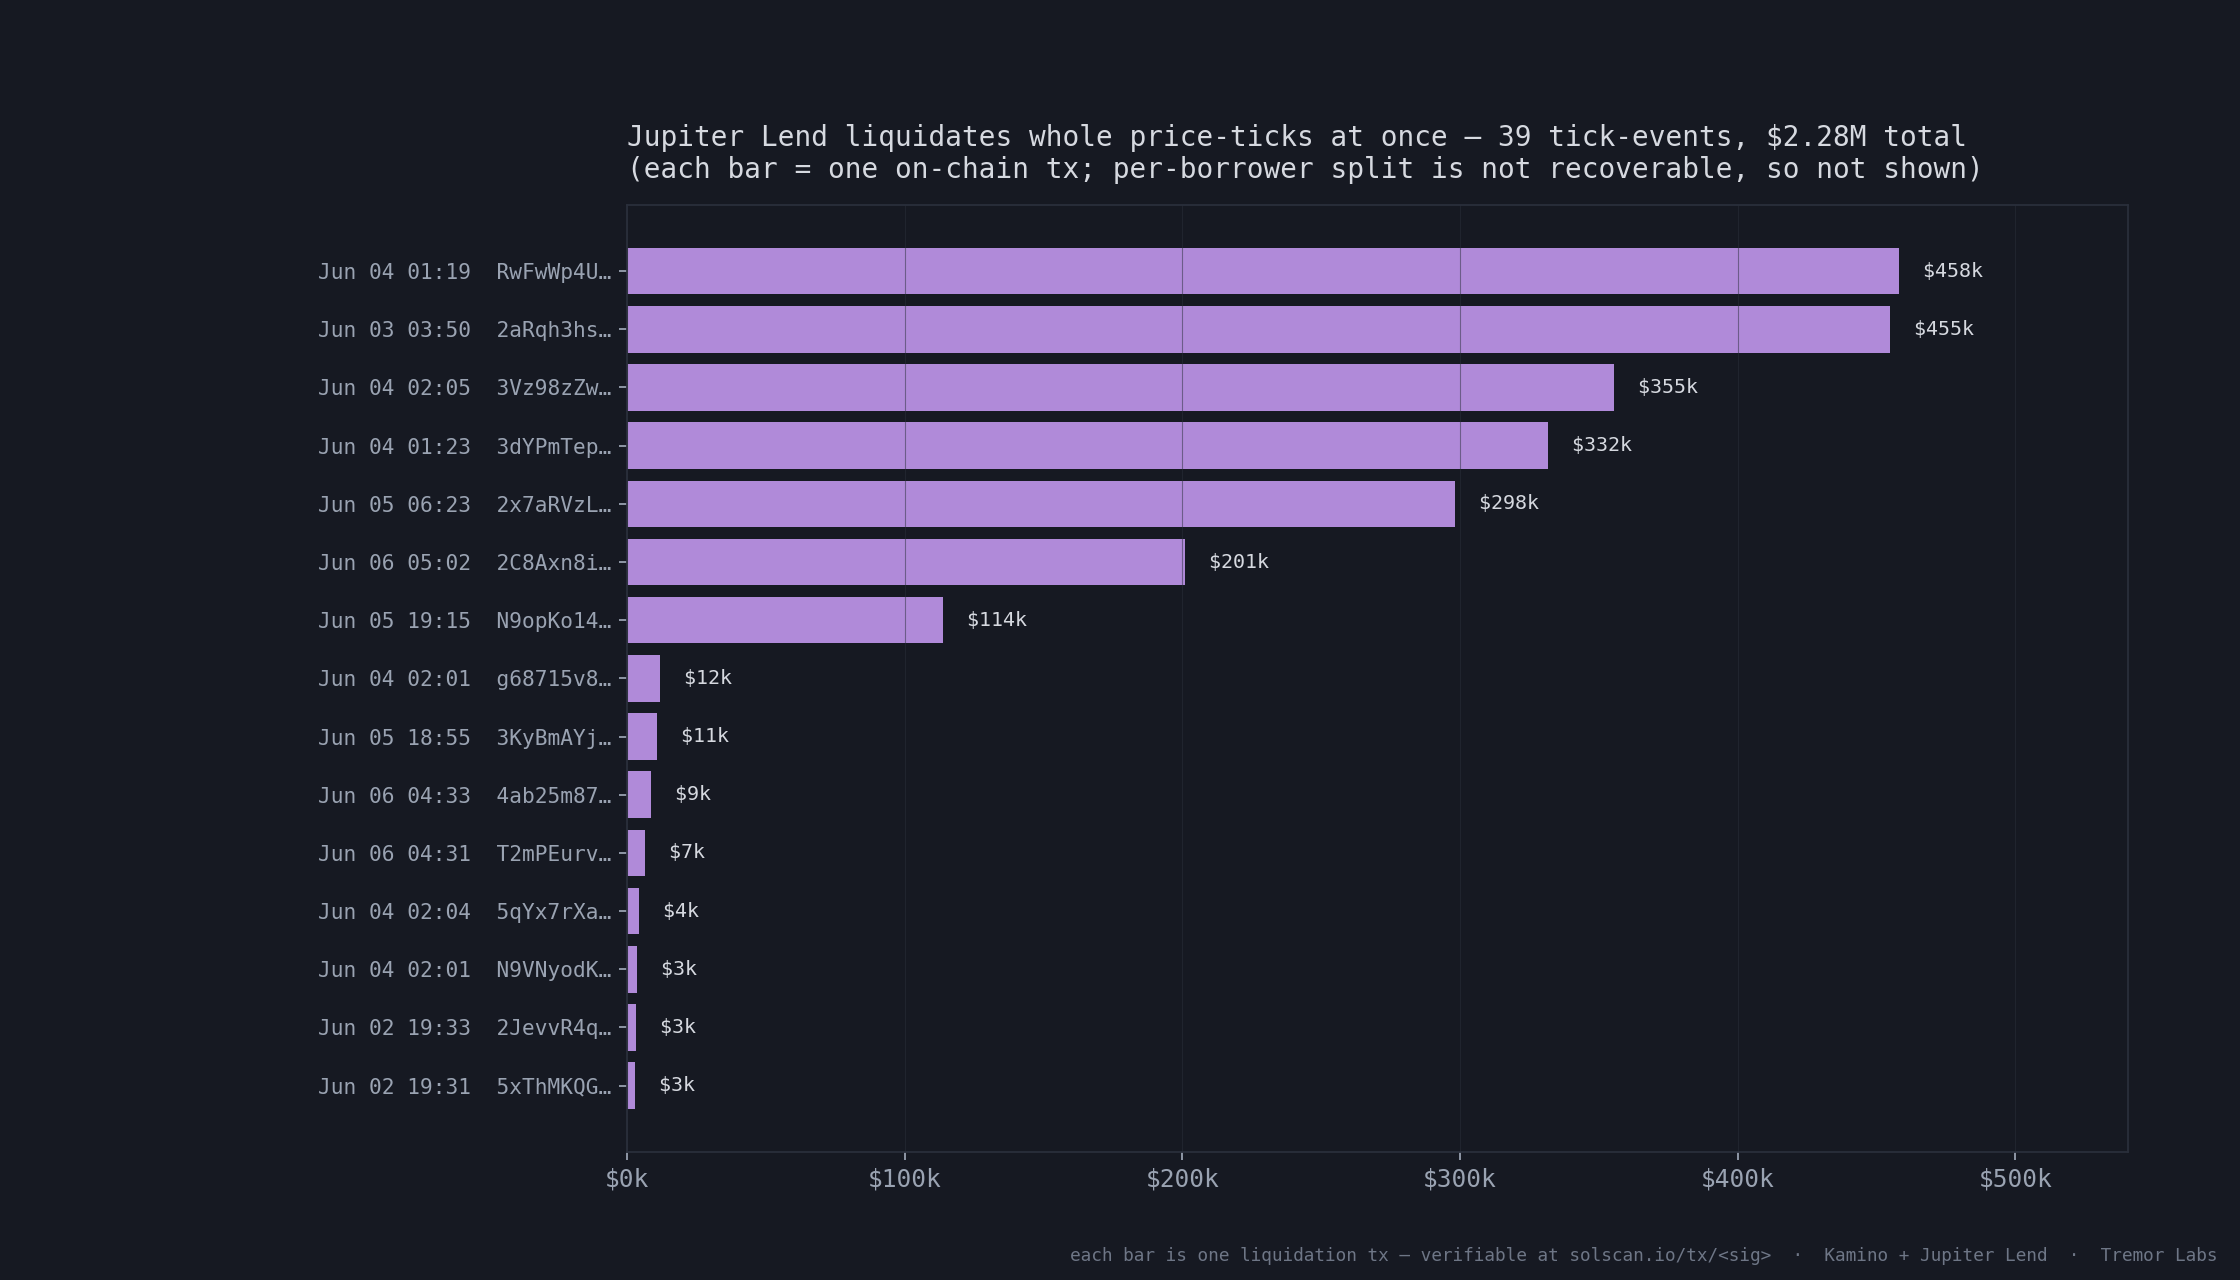
Jupiter only. Largest tick-liquidations (per-tx, whole price-bands). Tick-level only — not comparable to per-borrower figures.
The SOL crash (Jun 2–6 2026), sliced across Kamino + Jupiter Lend. Every Kamino figure is verifiable on-chain.
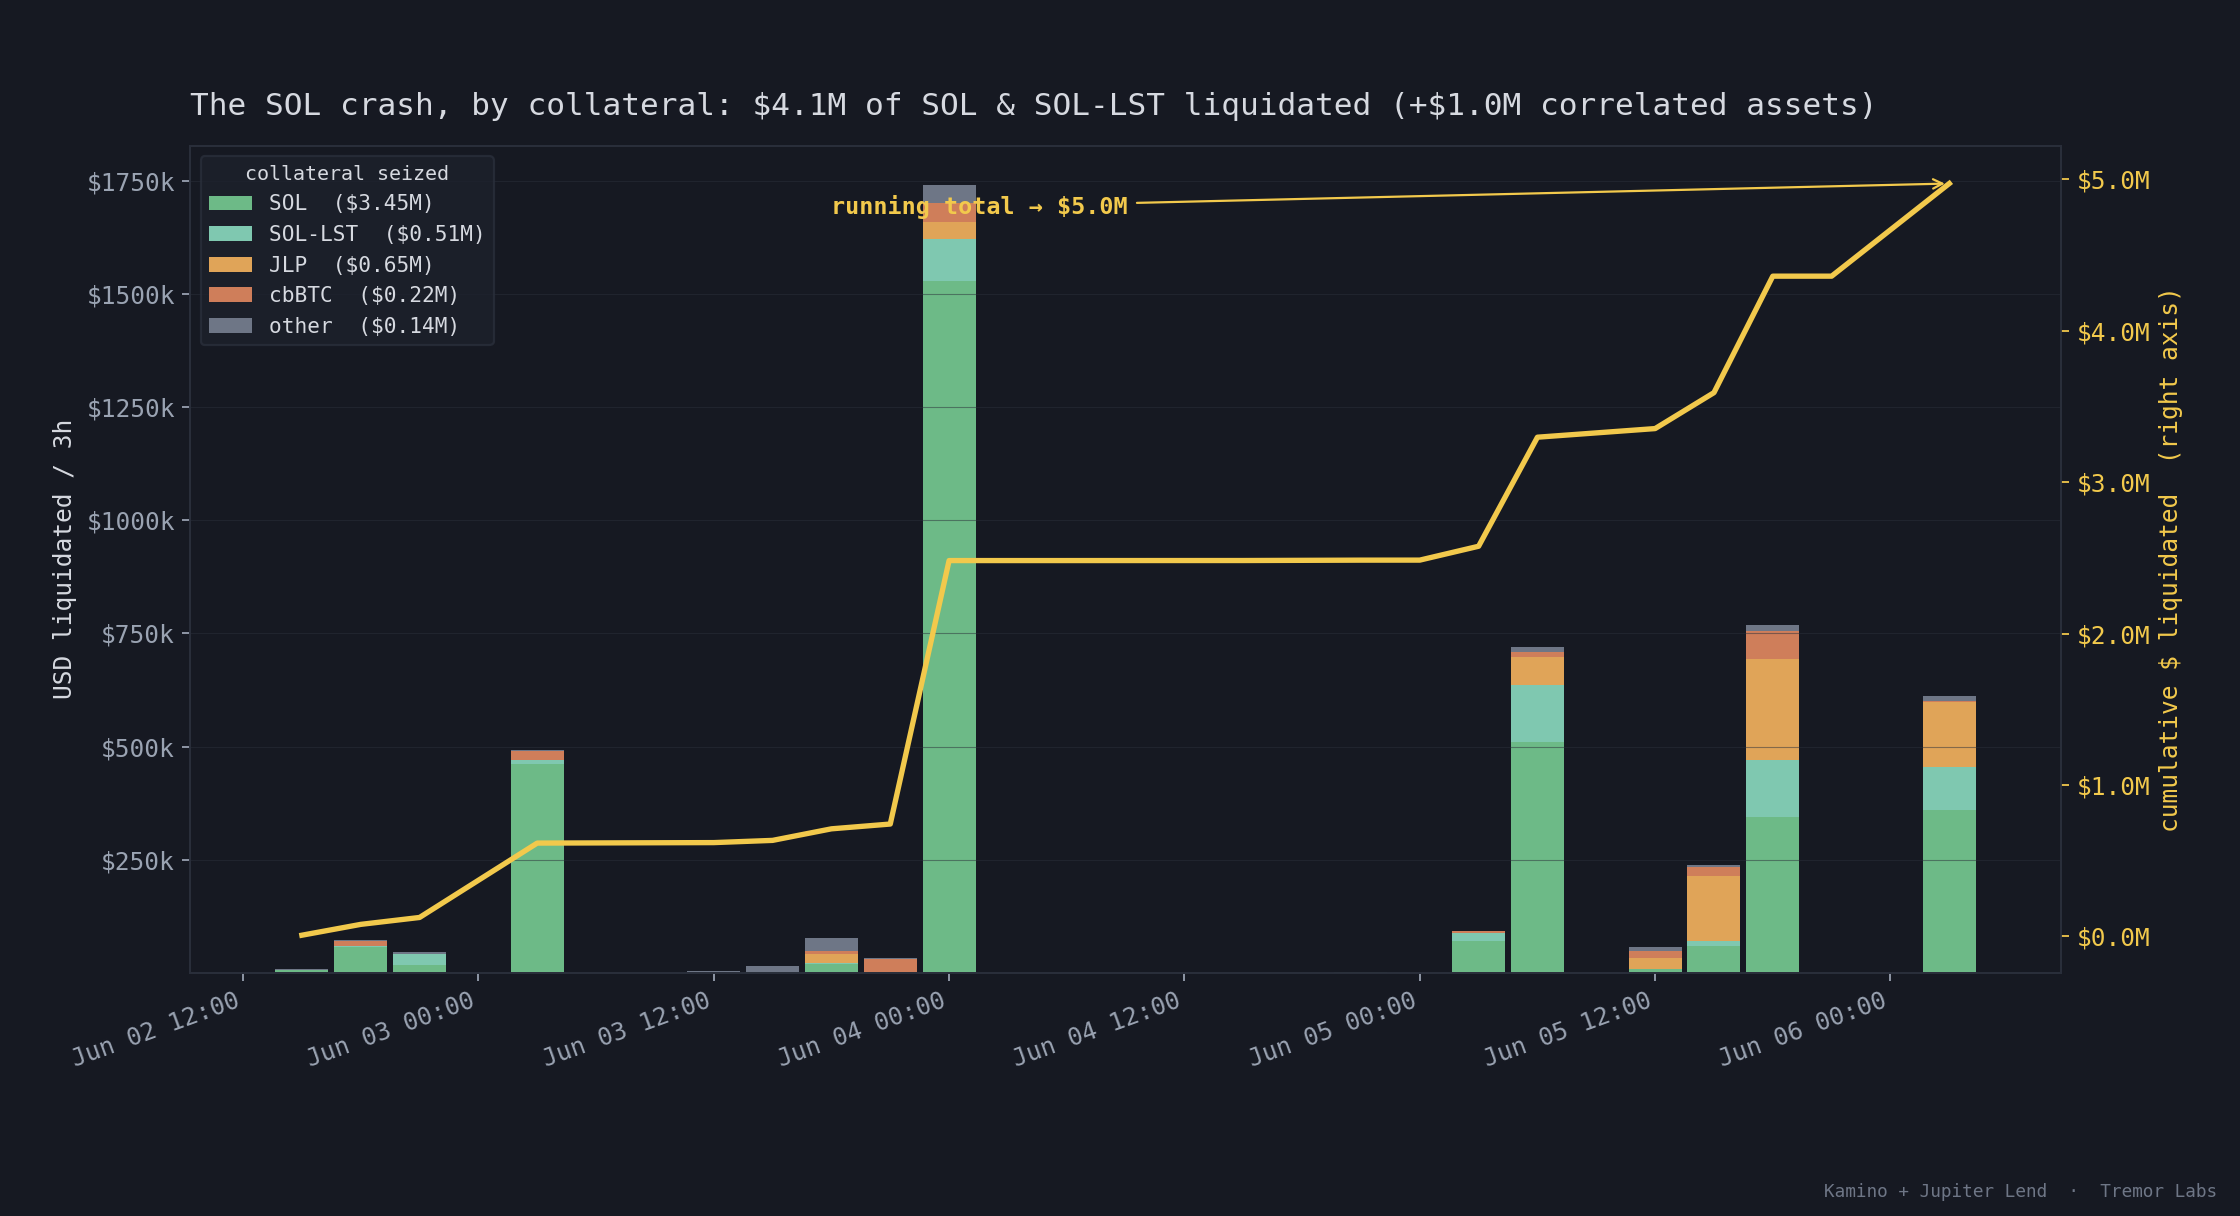
$ liquidated per 3h, stacked by collateral; the yellow line is the running total. 47% of the month's value landed in the worst 24h.
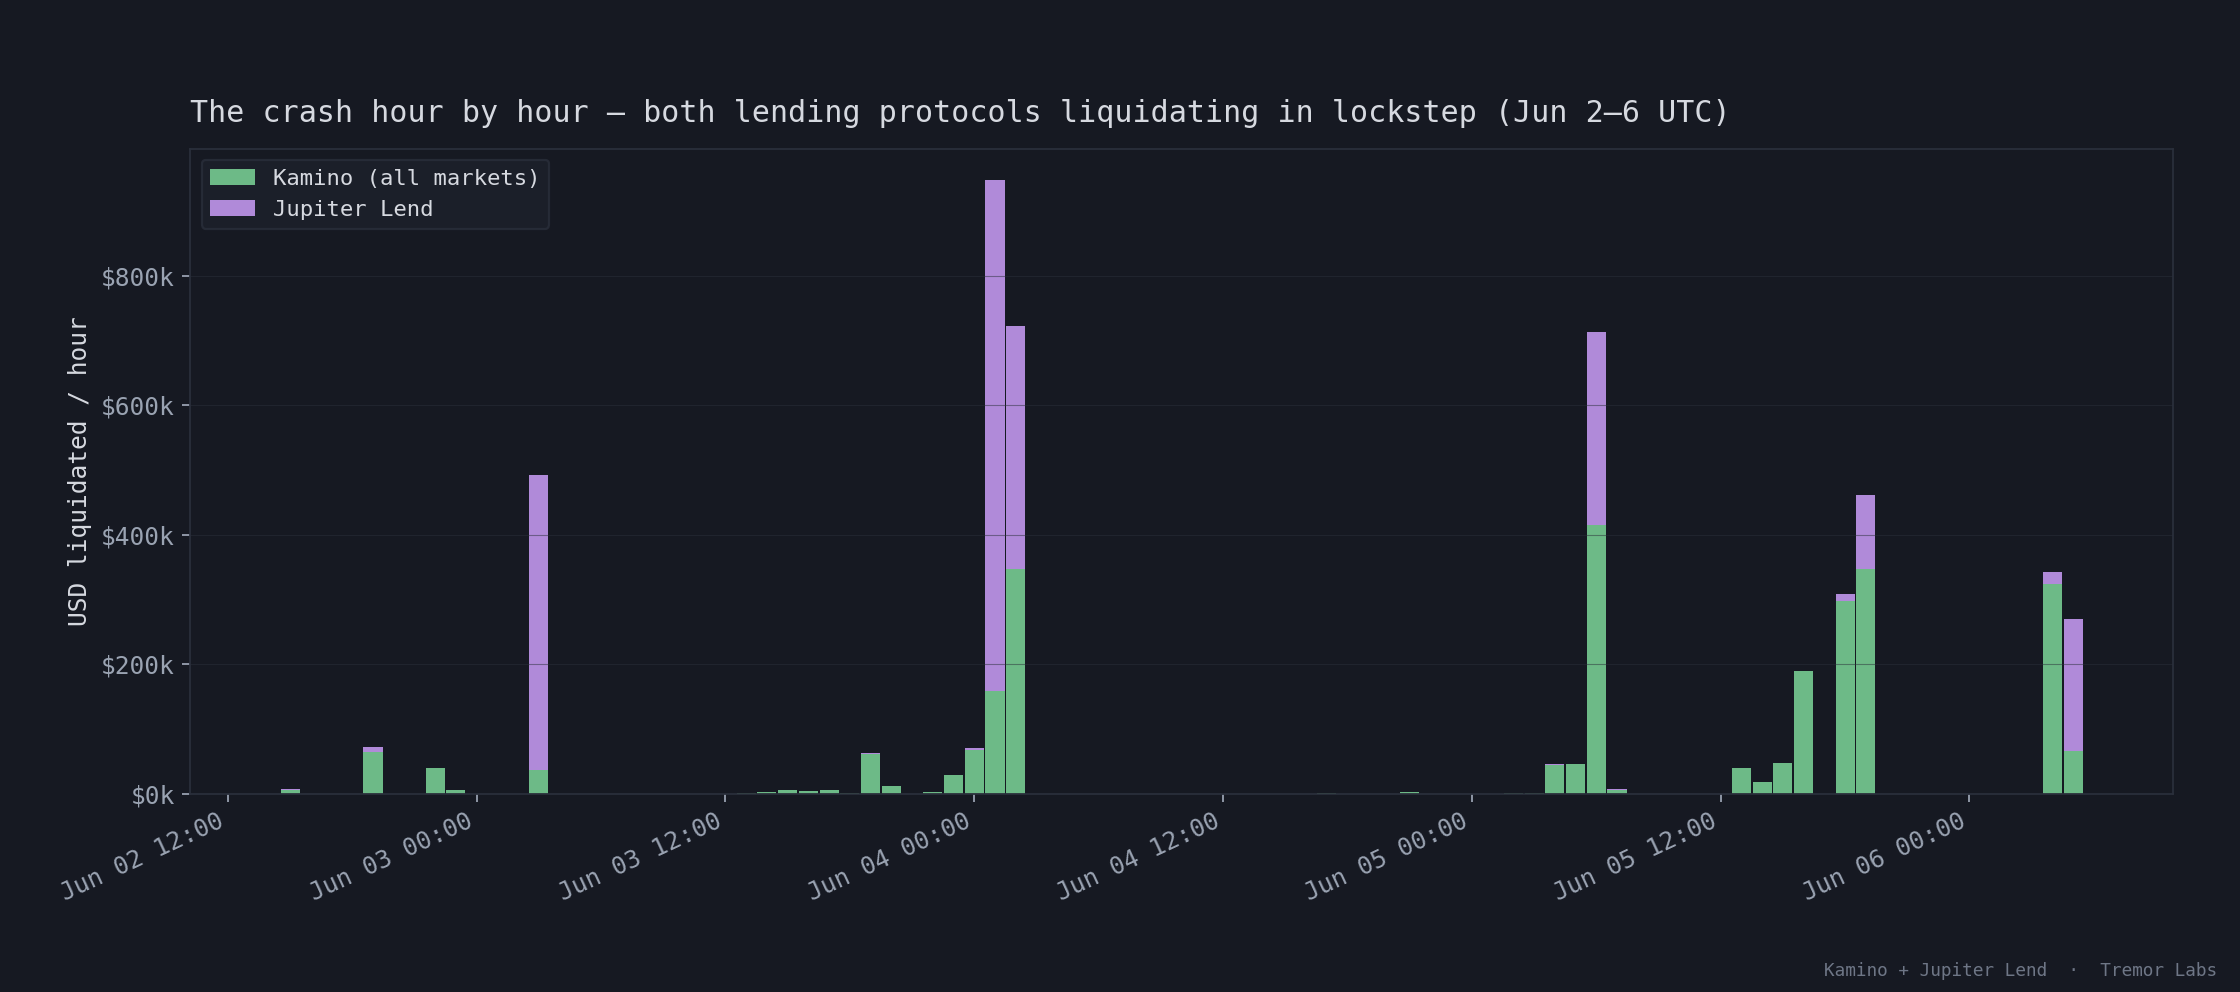
Hour-by-hour, $ split by protocol.
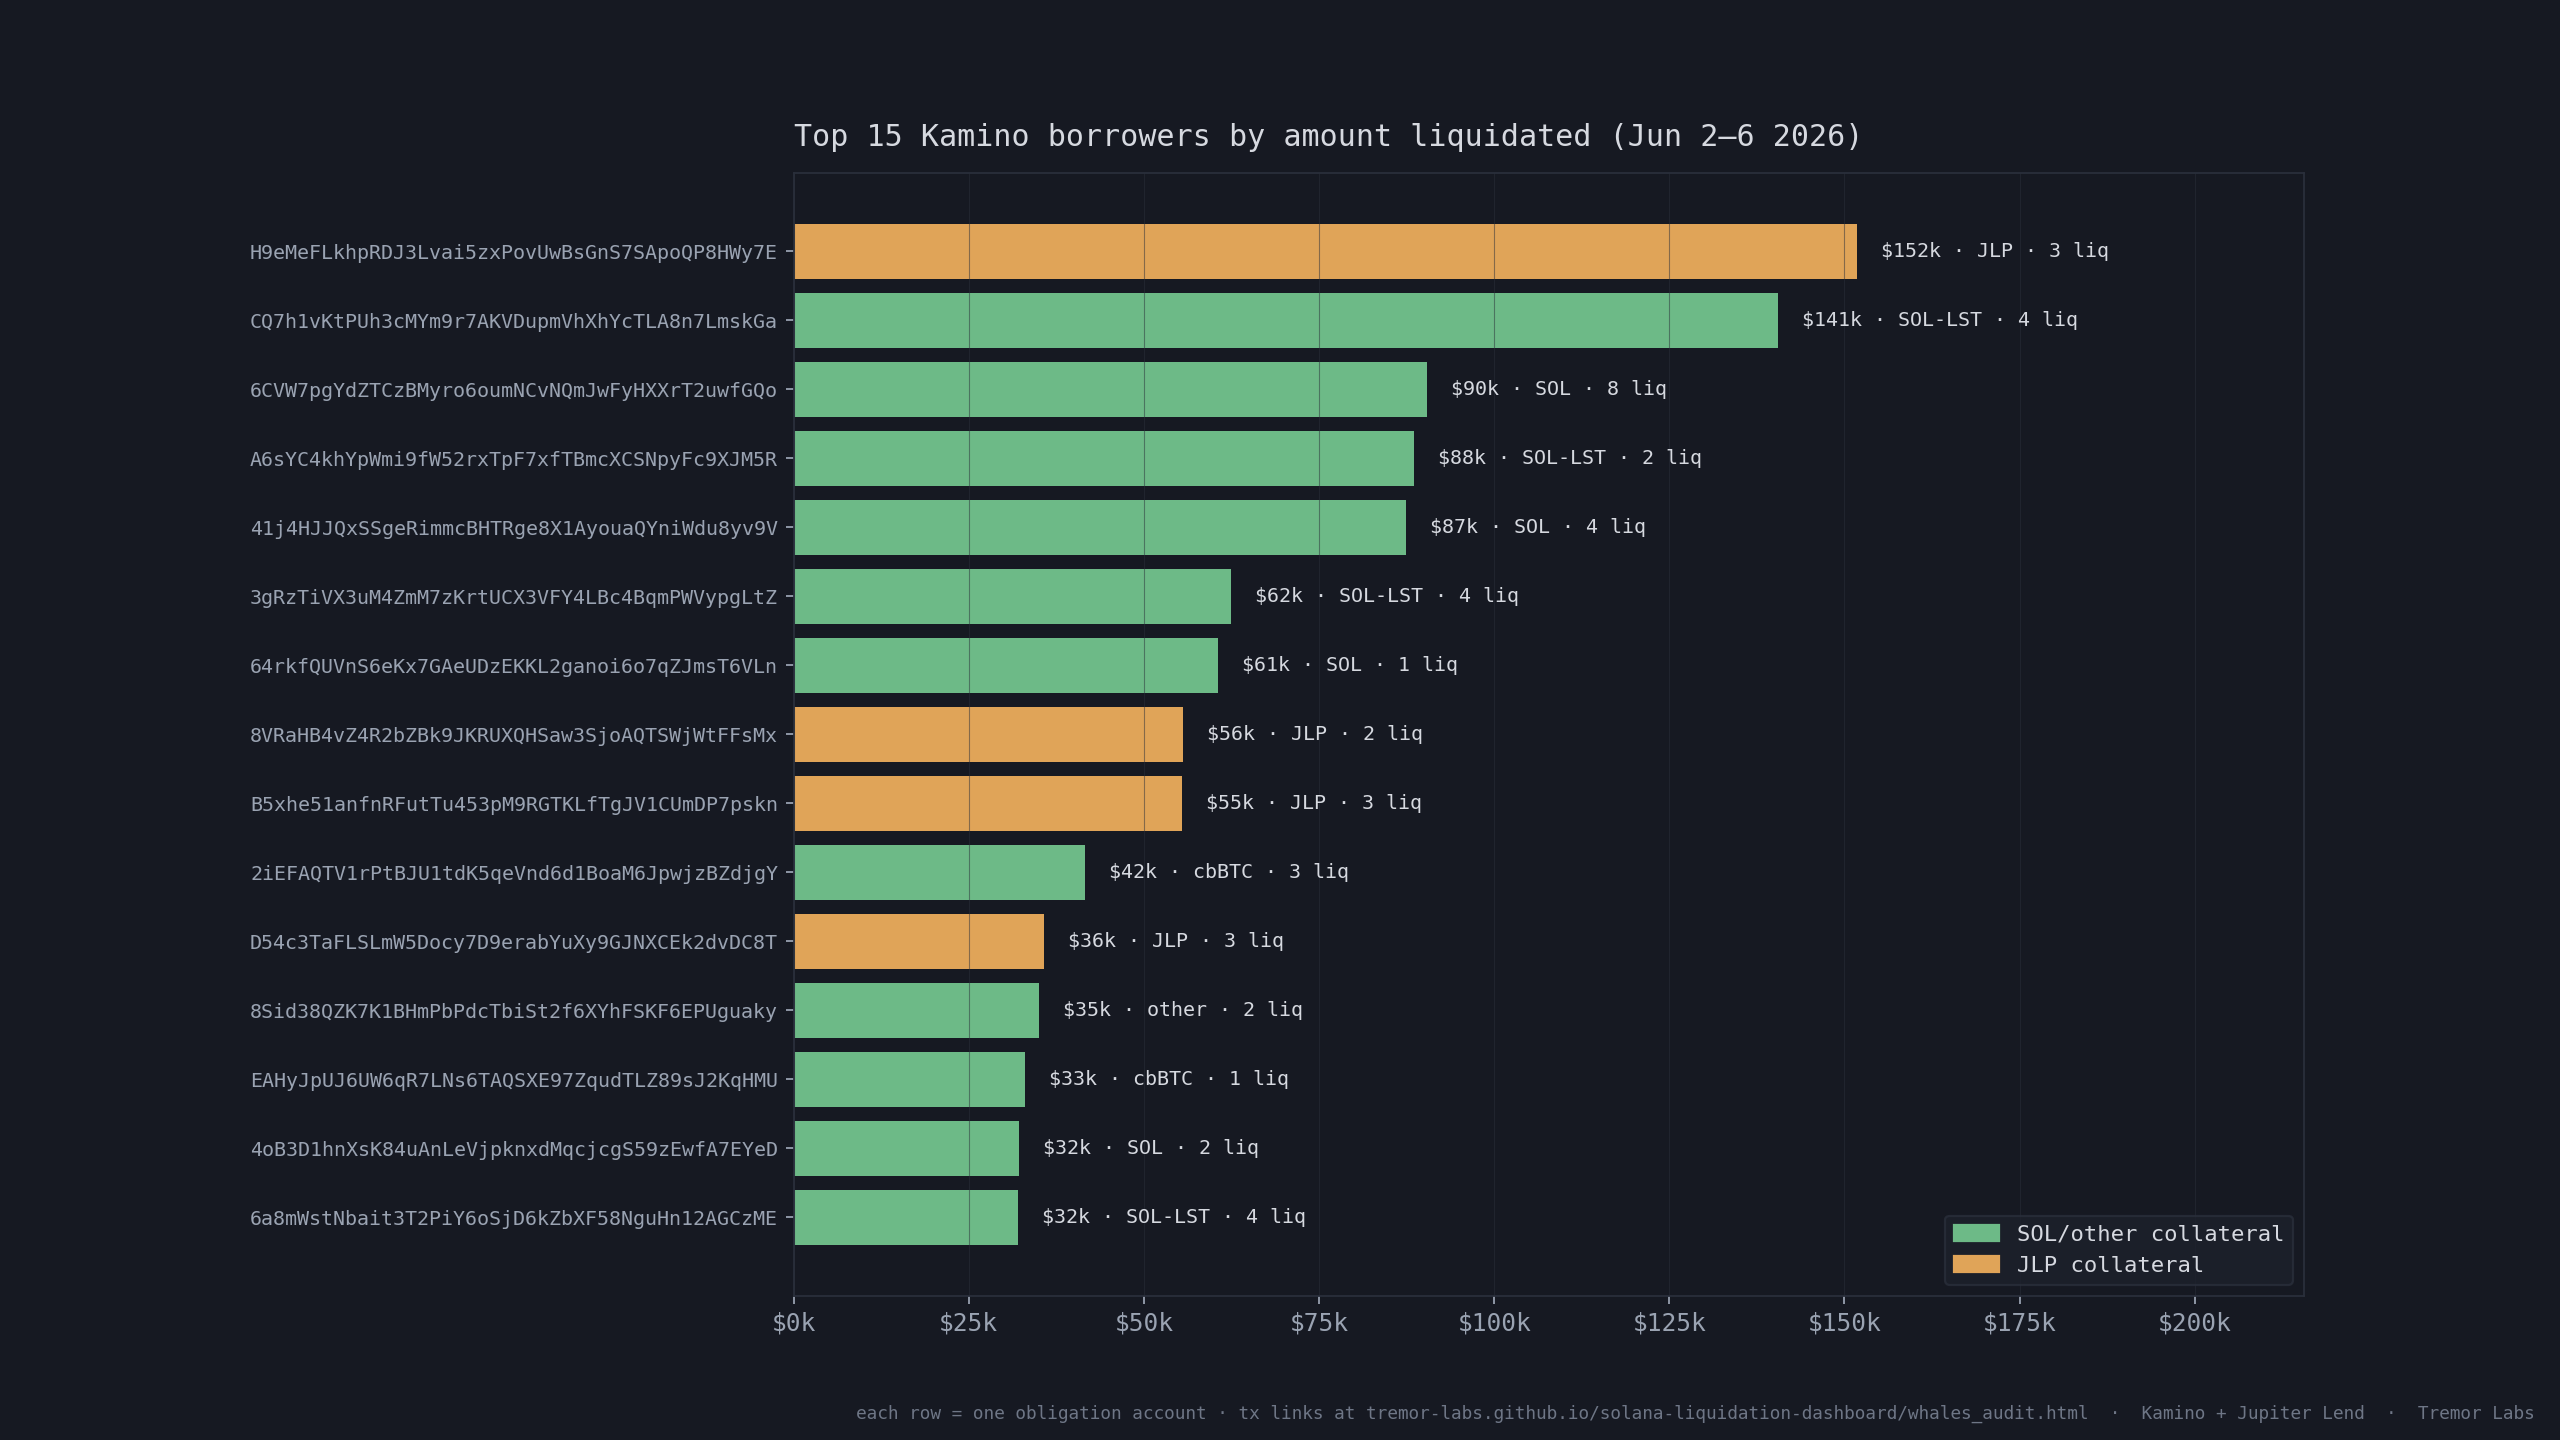
Top 15 Kamino borrowers by $ liquidated — every figure on-chain-verifiable.
Kamino only. 88% of liquidations <$100; top 1% = 78% of value.
Jupiter only. Largest tick-liquidations (per-tx, whole price-bands). Tick-level only — not comparable to per-borrower figures.
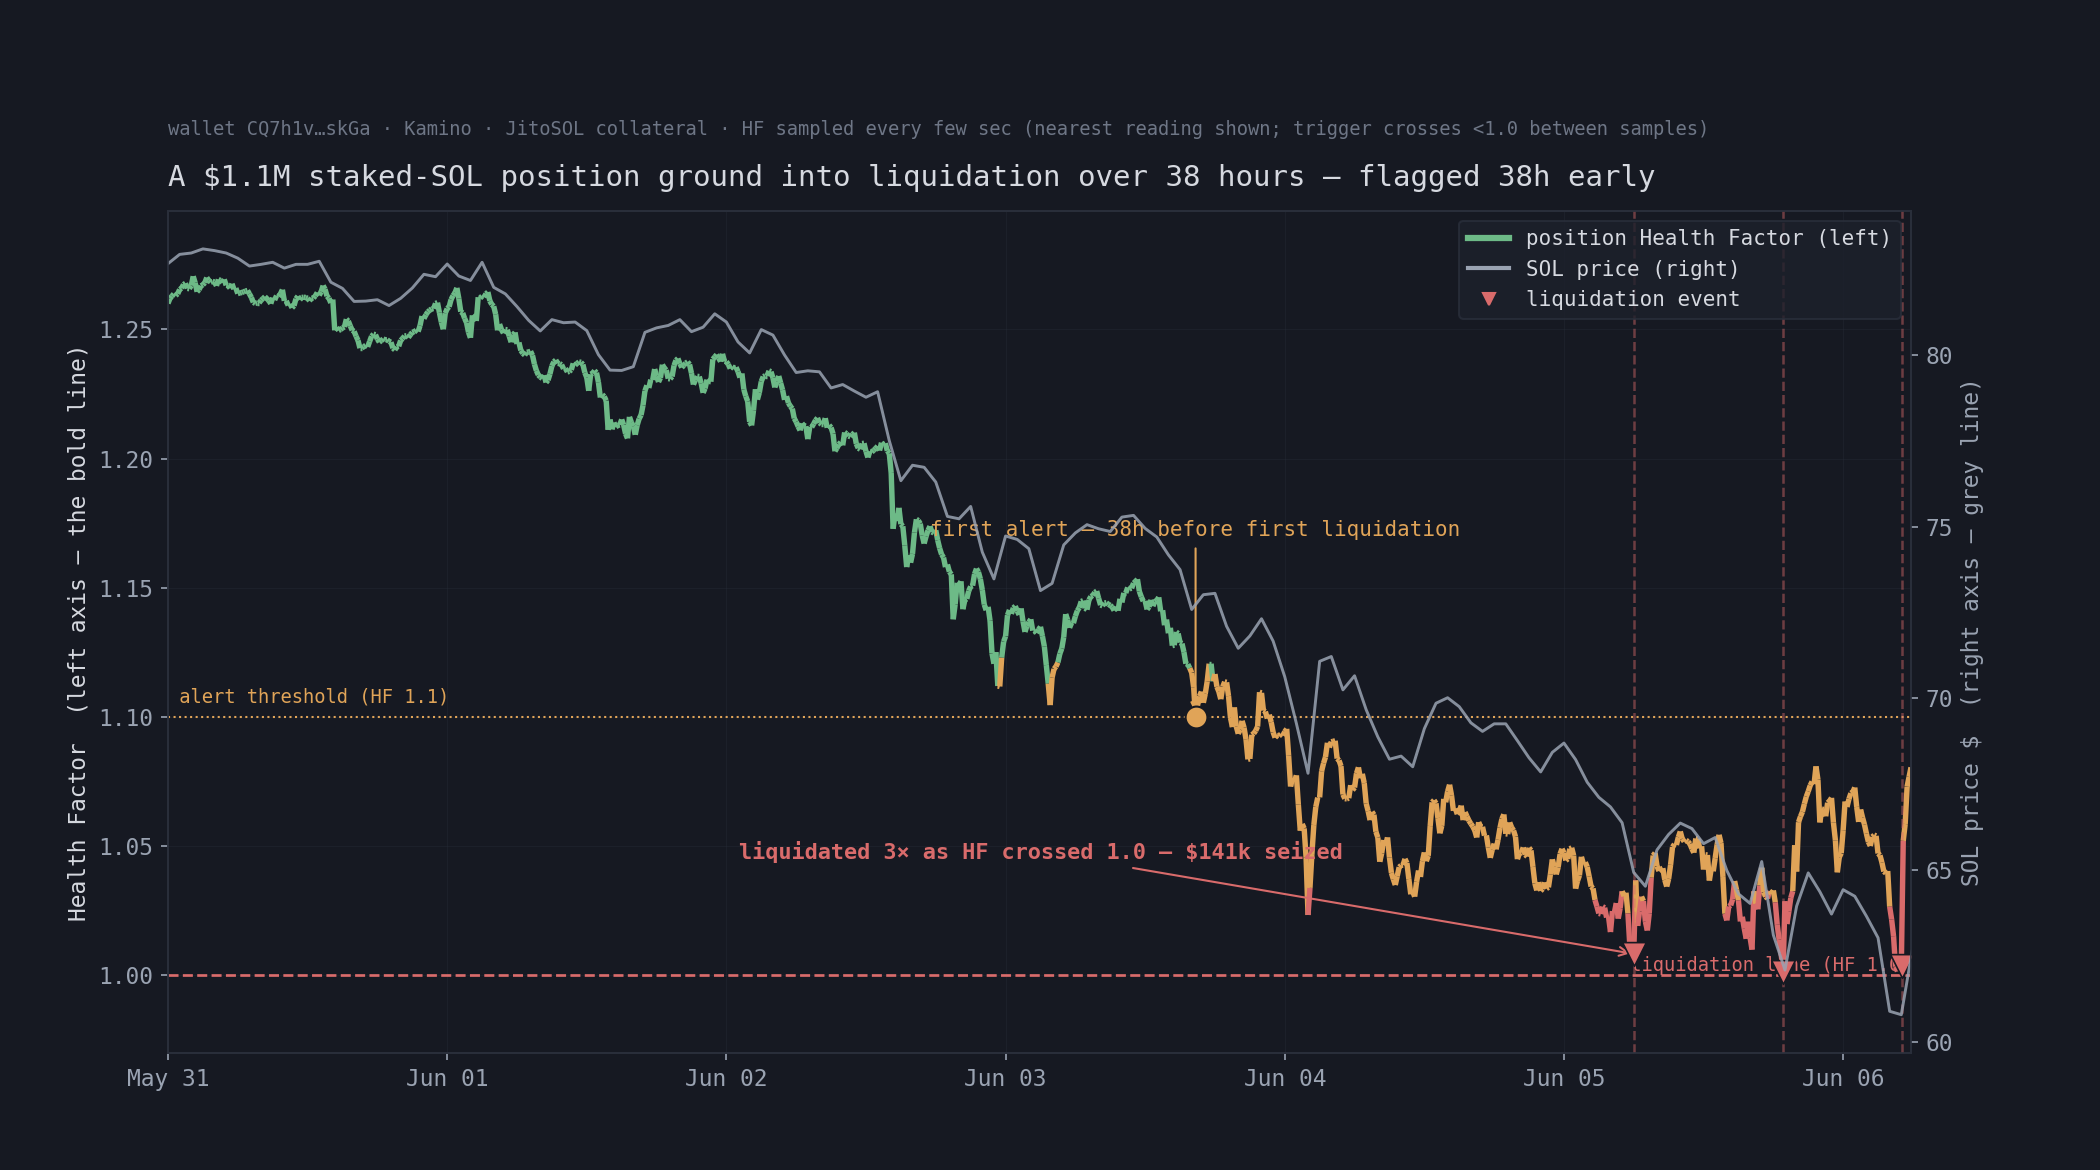
A ~$1.1M JitoSOL position, its health factor grinding into liquidation over ~38h as SOL fell. $140,508 seized across 4 liquidations. 🔎 audit this whale →
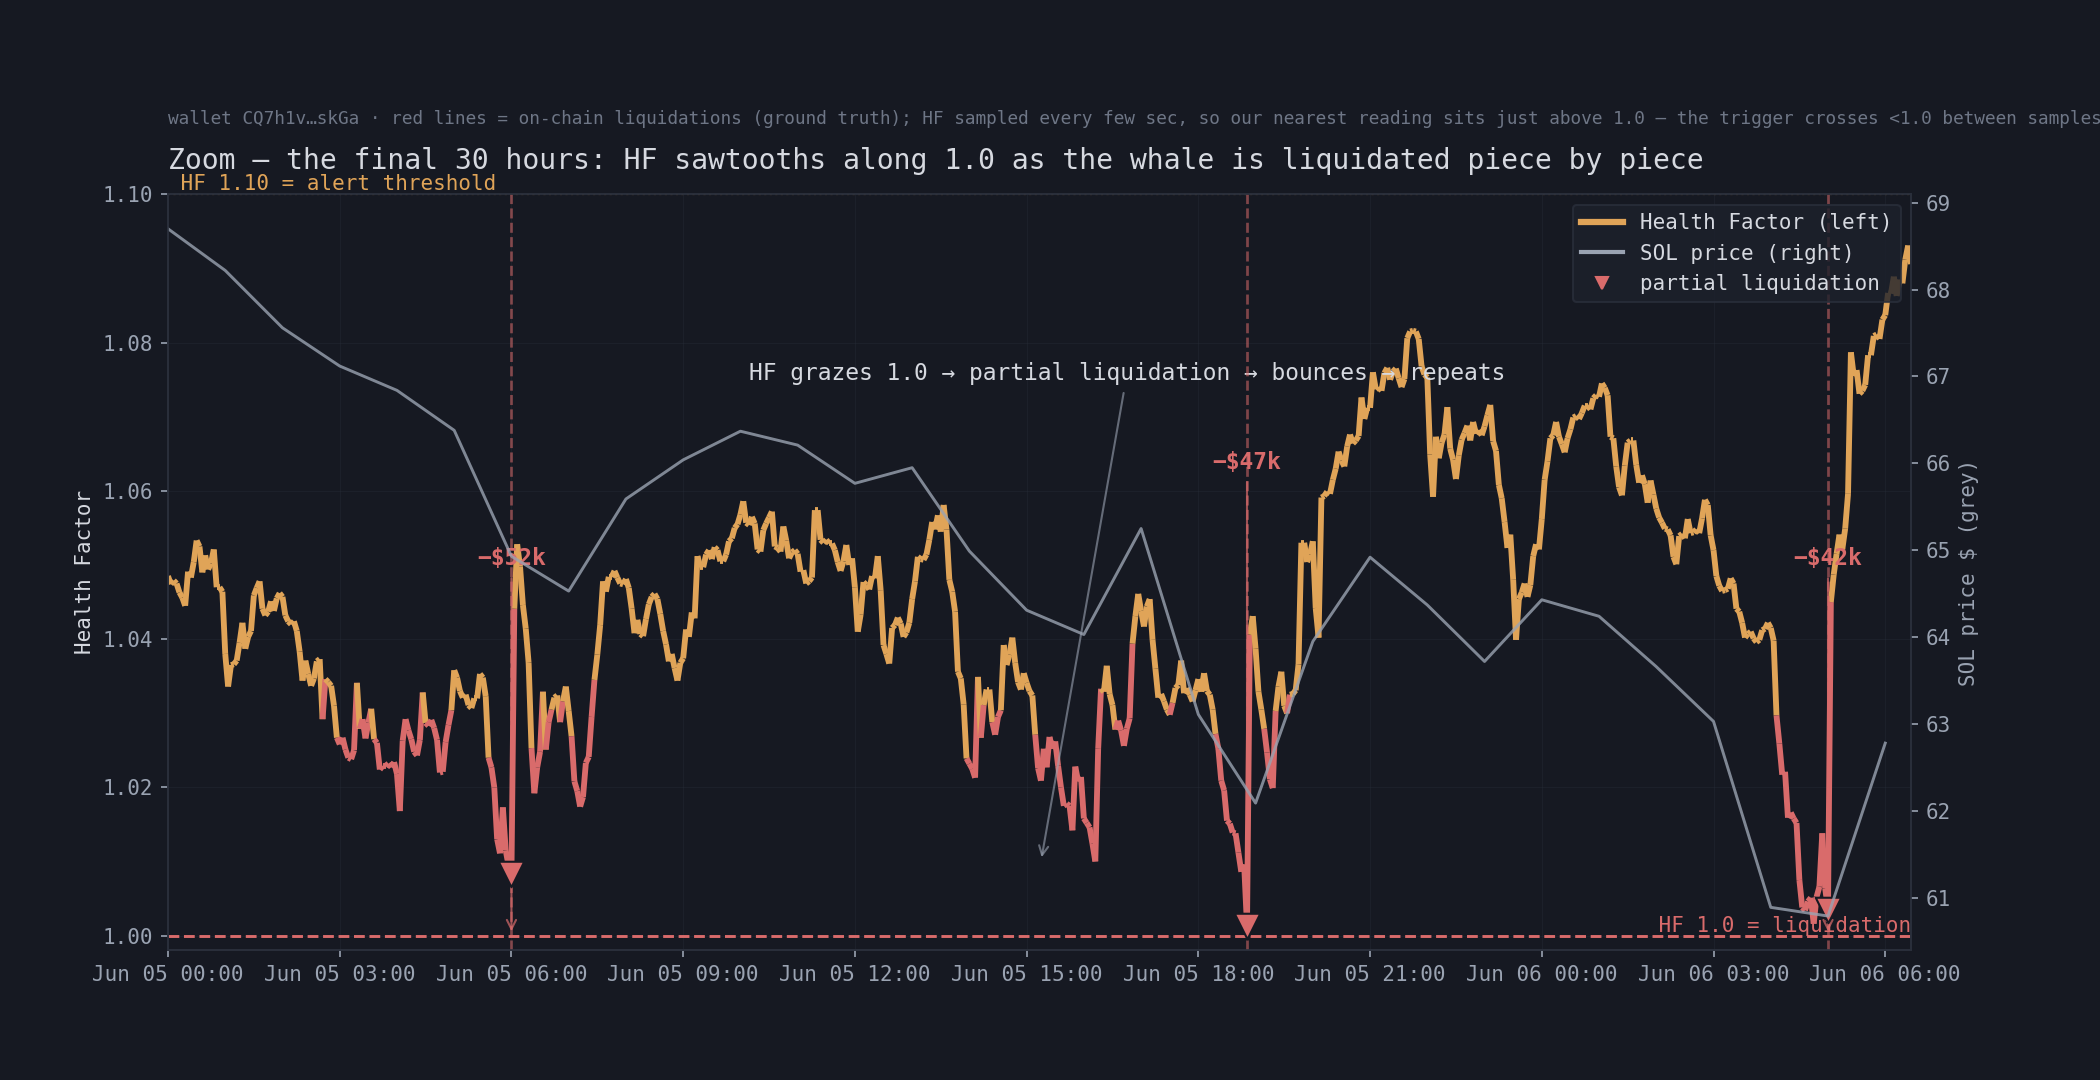
Zoom: HF sawtooths along 1.0, liquidated piece by piece. Red lines = on-chain liquidations; HF sampled every few seconds. 🔎 audit these txs →
Source: on-chain liquidation events. Kamino figures are per-obligation — every dollar traces to a transaction (see the audit page). Jupiter Lend liquidates a whole price-band per transaction, so it's reported per-tick, never per-borrower. The only cross-protocol figure is total $. Coverage is Kamino markets + Jupiter Lend.
Tremor Labs · Solana Liquidation Intelligence — figures verifiable on-chain.